Strong January job gains and a surprisingly large array of annual benchmark employment revisions

New York City began 2024 with a strong seasonally adjusted private job gain of over 25,000 jobs, five times the average monthly gain during 2023. In addition, there was a 12,000-job increase in local government employment in January, making up half of the net decline in city government jobs over the past four years. The January numbers are still preliminary and there is a chance that they could be revised downward, as happened with the national job figures in the March 8th release of the February employment report. If, however, the January gains hold up, New York City’s job picture could be showing signs of improvement over the past year.
The bigger story at this juncture was the March 7th release of the annual benchmark employment revisions. Each year in early March, the State Labor Department revises the monthly survey-based payroll employment data for the previous two years. The monthly data are revised based on the complete administrative data compiled in connection with the administration of unemployment insurance. Employers are required to submit quarterly unemployment payroll taxes based on their actual job counts.
Three takeaways from the annual benchmark revisions
CNYCA analysis of the benchmark revisions points to three key takeaways: 1) New York City’s total December 2023 employment level was revised down by 13,400, a fairly slight 0.3 percent; 2) there were significant revisions (some up, some down) affecting several specific industries; and 3) the overall pattern of revisions doesn’t change the broader contours of how the city’s labor market has been re-shaped by the pandemic and recovery.
The chart below shows significant revisions for December 2023 for 18 specific industries, including an unusually high number of industries with employment revisions of 4,000 jobs or more (or five percent or greater). Employment in 10 industries was revised upward, and job counts were revised downward in eight industries. Three industries had downward revisions of more than 10,000 jobs: private colleges and universities (-21,100); construction (-14,000), and home health care (-13,700). There were, on the other hand, positive revisions in retail and transportation, two sectors that had been pummeled by the very slow recovery from pandemic disruptions. Within retail, there was a surprisingly strong 18 percent upward employment revision in clothing and accessory stores. In the transportation sector, three sub-sectors –transit and ground passenger
Figure 1
transportation, support services for transportation, and air transportation – each recorded upward employment revisions of six to 14 percent.
Among higher-paying industries, job counts were revised upward in three finance sector industries: investment banking, portfolio management, and commercial banking. However, three industries within high-paying professional services had downward revisions: legal services, advertising, and management consulting.
Revisions don’t change the broad contours of the city’s post-pandemic labor market
Even though several individual sectors experienced significant employment revisions, the broad contours of post-pandemic employment change that had emerged a year ago remain unchanged in the three categories CNYCA utilizes in our labor market analysis. Although New York City’s total employment level is now nearly 28,000 (0.6 percent) jobs greater than four years ago, the
combined employment in the face-to-face set of industries that was hardest hit by pandemic business disruptions is nearly 132,000 less than in February of 2020, a collective 6.5 percent decline. A loss of that magnitude signals a very deep economic downturn for a category that employed two million workers four years ago. The home health care and individual and family
services industries, both within the essential industries category, still lead the list of industries recording the greatest net job growth over the past four years (as shown in a later chart), and both are among the lowest-paying of all New York City industries.
Figure 2

Within the face-to-face category, construction, manufacturing, and retail trade are all continuing to suffer double-digit job declines. Within leisure and hospital, employment in the arts, entertainment, and recreation sector is more than nine percent below pre-pandemic levels, and employment in accommodation and food services is still nearly 23,000 jobs below February 2020 levels. The pace of recovery for both of these sectors slowed appreciably in 2023 compared to the prior year.
The timing of the benchmark revisions on a monthly basis indicates that the strength of the city’s job rebound occurring in 2022 (that is, between December of 2021 and December of 2022) was slightly less robust than previously thought, while there was a greater net job gain in 2023 (December 2022 to December of 2023) than depicted in prior data. Growth occurring in 2022 was revised down from 5.4 percent to 4.6 percent, and 2023 job growth was revised upward from 54,000 to 73,000, raising the growth rate from 1.2 percent to 1.6 percent. The overall picture remains as we had described it in previous reports: that the pace of the city’s employment rebound and growth slowed markedly in 2023 compared to 2022.
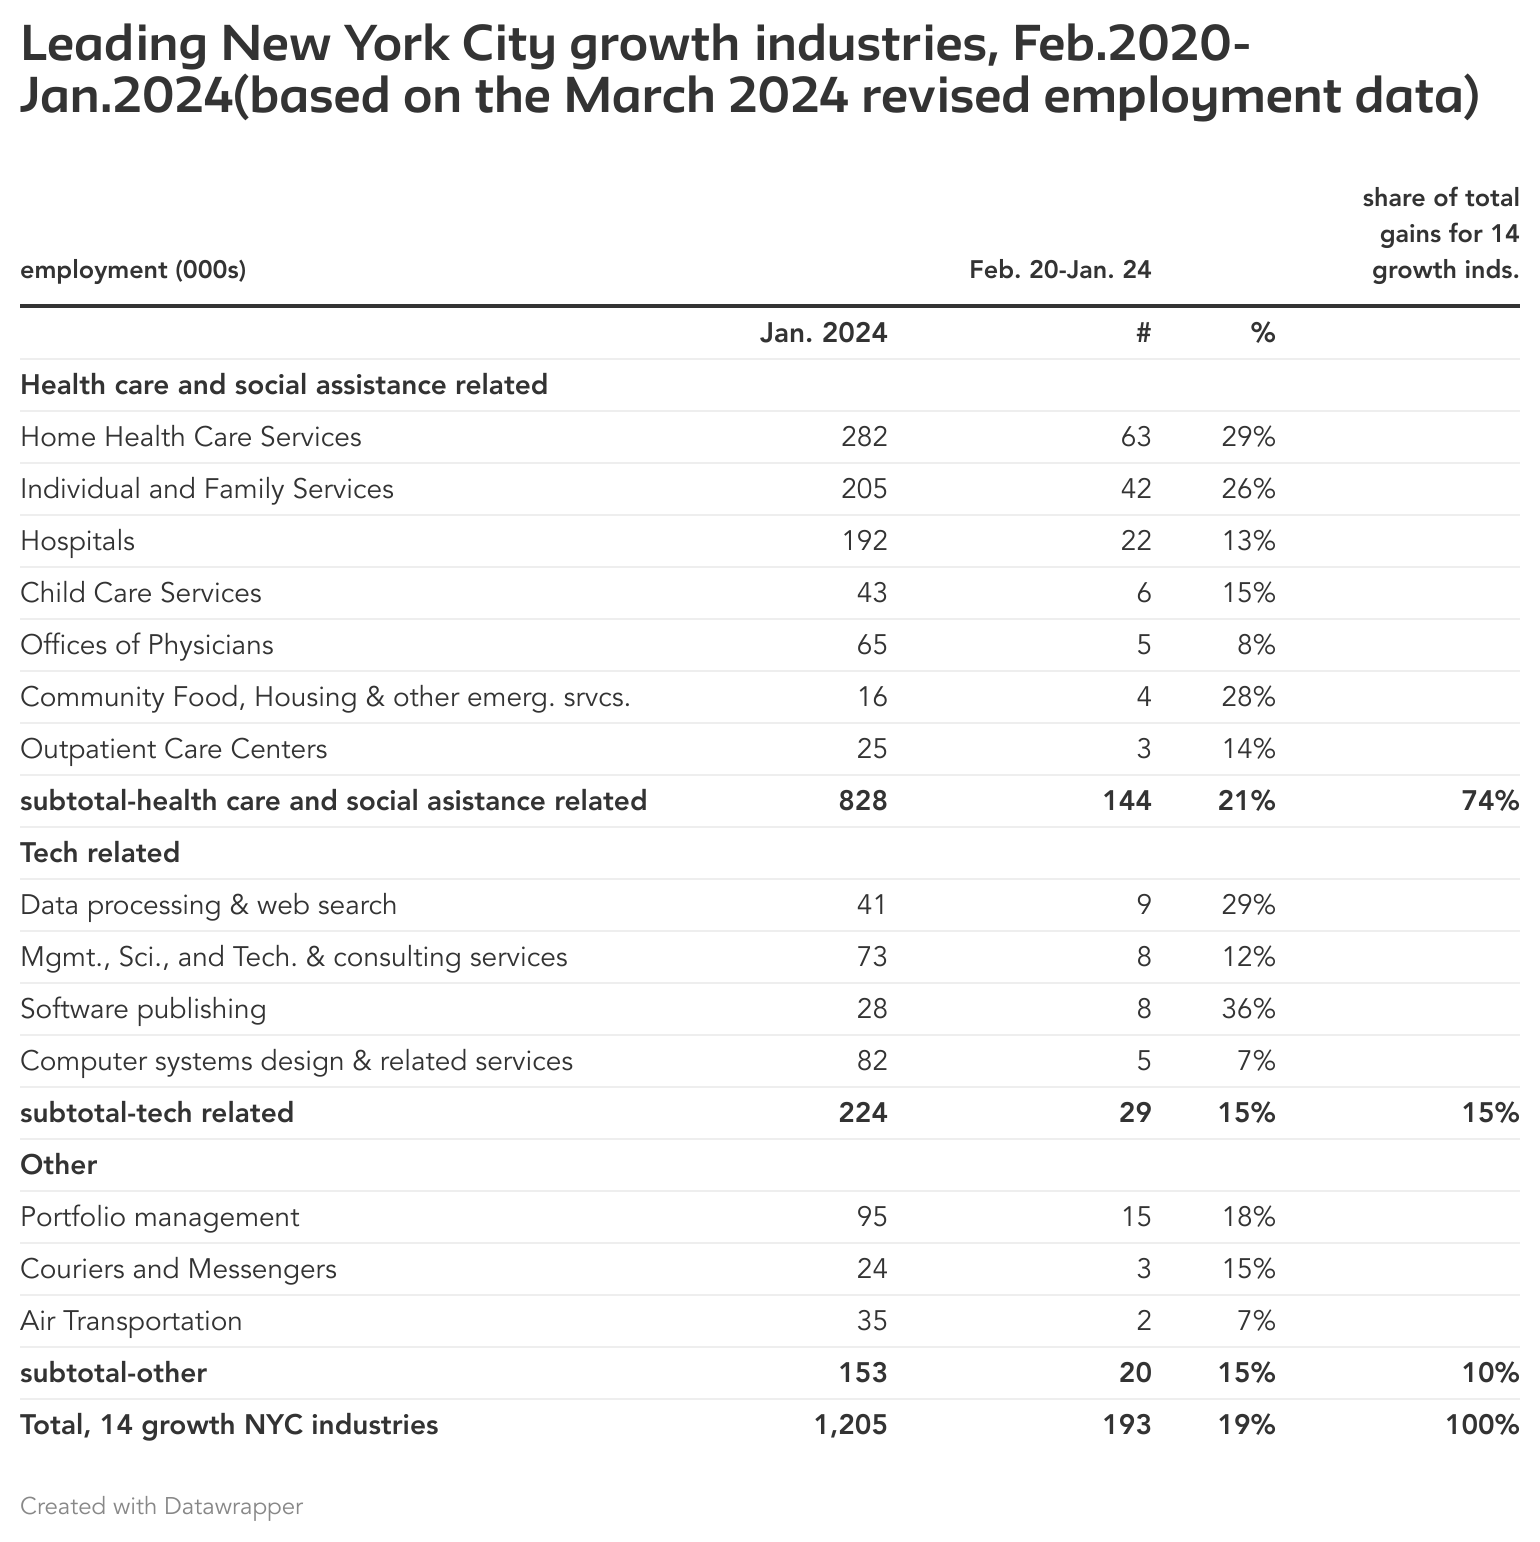
NYC growth industries dominated by health care and social assistance
Despite the downward revision in the December 2023 job count for home health care services shown in the first chart above, the industry still leads the list of industries recording the largest net job gains since February 2020, with a net gain of 63,100 jobs over the past four years. Individual and family services remains the second-greatest job growth contributor, with a gain of nearly 42,000 jobs. Five other health care and social assistance industries are also on the growth industries list: hospitals (+21,600); child care (+5,500); physicians’ offices (+5,000); community, food and housing emergency services (+3,500); and outpatient care centers (+3,100). Altogether, these seven health care and social assistance industries have generated 144,000 jobs, or nearly three-quarters of all net New York City job gains over the past four years.
As indicated in Figure 3, four tech industries accounted for a total of 29,400 job gains over the past four years. That is a little over 15 percent of the combined total for the 14 industries showing job growth over the past four years composing this chart. This is down slightly from the 32,000- job total for a similar chart CNYCA published in January of 2023, reflecting some downsizing experienced in the industry over the past year.
Figure 3
Minor State Labor Department revisions to labor force data
At the time of the annual payroll survey revisions, the State Labor Department also revises the labor force series, technically referred to as the Local Area Unemployment Statistics. This is data that is based on the Current Population Survey of households and an associated labor force model. According to the revised labor force data, New York City’s average unemployment rate for 2023 was reduced by one-tenth of a percent from 5.3 to 5.2 percent (with one-tenth of a percent increases for 2021 and 2022). The city’s seasonally adjusted unemployment rate declined from 5.3 percent in December to 5.2 percent in January. As of December of 2023, the size of the city’s labor force was revised upward by about 25,000, with the result that the labor force participation rate (LFPR) declined by about a half-percentage point with the revision. The city’s January LFPR was 61.8 percent.
Updated New York City industry wage analysis
Last summer, CNYCA reported that wage gains for the city’s high-wage industries over the three prior years (2019-22) had outpaced gains for low- and middle-wage industries. The most recent Labor Department wage data through the third quarter of 2023 indicate that this wage growth disparity has widened further. Average inflation-adjusted wage gains have risen by 3.8 percent annually for high-wage industries since 2019 (up from 2.5 percent between 2019 and 2022), while average wage gains for workers in low-wage industries slipped from 0.5 percent annually 2019-2022, to 0.4 percent for 2019 through the first three quarters of 2023. Average gains for workers in middle-wage industries improved from 0.6 percent to 1.7 percent, but still lagged far behind the growth for workers in high-wage industries, who have garnered 71 percent of all city wage gains over the past four years.
Figure 4