The Reinvestment Myth: Beyond the IBO Report
 The idea of reinvesting savings from one part of the child welfare system into another sounded perfectly logical when it was first proposed in a city strategy paper in 2001, especially to anyone unfamiliar with the vagaries of government social services funding.
More than a decade ago, before Michael Bloomberg became mayor, New York City policymakers saw a huge trend in the making: the number of children in foster care was tumbling downward, alongside crime rates and the once epidemic use of crack cocaine. Of course, there were other factors: families were helped by great improvements in the city's economy, for example, and there was also a growing realization in the child welfare field that placing 10,000 or more children in foster care each year was no panacea for what ails troubled families living in severe poverty.
The idea of reinvesting savings from one part of the child welfare system into another sounded perfectly logical when it was first proposed in a city strategy paper in 2001, especially to anyone unfamiliar with the vagaries of government social services funding.
More than a decade ago, before Michael Bloomberg became mayor, New York City policymakers saw a huge trend in the making: the number of children in foster care was tumbling downward, alongside crime rates and the once epidemic use of crack cocaine. Of course, there were other factors: families were helped by great improvements in the city's economy, for example, and there was also a growing realization in the child welfare field that placing 10,000 or more children in foster care each year was no panacea for what ails troubled families living in severe poverty.
So in 2001, the Administration for Children's Services (ACS) established a reform goal of reinvesting savings from the shrinking foster care system into social services, including case management, drug treatment, counseling, benefits advocacy, homemaking and more, all designed to help families, keep children safe and prevent placements in foster care.
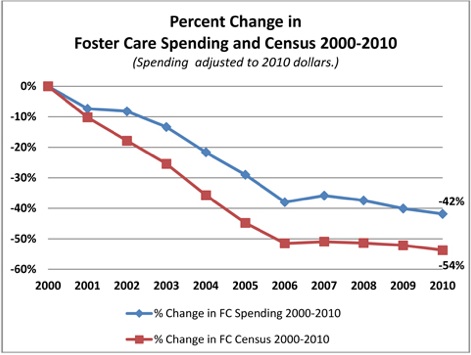
Did it happen? Not so much. The charts below show there was very little reinvestment despite a huge, 40 percent decline in overall government spending on New York City foster care between 2000 and 2010. Remarkably, the number of foster children continues to fall. As of July 2011 there were 14,308 foster children, down 58 percent since 2000.
And yet, this year, New York City taxpayers' contribution to preventive family support services is almost exactly the same as it was 12 years ago.
With the help of the NYC Independent Budget Office (IBO), Child Welfare Watch mapped the impact of the last dozen years in budget and spending trends on ACS-funded services. The charts below show what we've found. Some of this analysis is found in a report published by the IBO last week. But with that agency's assistance, we chose a very different, and we think very useful, way to report and understand the numbers. And we've included some data here that are not in the IBO report.
Most importantly, in our charts and in the text below, all of the dollar figures are adjusted for the impact of inflation. In buying power, a dollar in 2010 had much less value than a dollar in 2000. Year after year, inflation wears away at the dollar's value. We believe inflation-adjusted dollars are a more logical way of comparing government spending over the years, rather than simply listing the actual (or "nominal") dollars spent each year in their value at the time. Why? Because the cup of coffee I bought at the deli for $1.45 this morning cost me just 65 cents in 2000. Much the same is true for the cost of salaries, benefits, office leases and all the other expenses that go into providing city-funded services.
When we adjust for inflation, for example, the $903.5 million that New York spent on foster care in 2000 has the buying power of $1.3 billion in 2010 dollars. (The IBO mostly uses nominal, unadjusted dollar figures in its reports).
These numbers tell a somewhat more sobering story than we heard from the IBO last week.
Chart 1. The Sharp Drop Foster care spending in New York City fell 40 percent from 2000 to 2010. Over the same period, the number of children in foster care declined by more than half. Foster care dollars go mostly to foster parents and to the nonprofit agencies that work with them, the children and their parents. (In all of these charts, we use the city fiscal year, which begins on July 1 and ends on June 30.)

Chart 2. Hundreds of Millions of Dollars Saved As the overall cost of foster care plummeted, total spending on preventive family support services increased, but the change was relatively modest.

Chart 3. Child Protective Services Grows Spending on child protective services, that is, the ACS Division of Child Protection's investigation of abuse and neglect reports, increased in the years following the murder of Nixzmary Brown in January 2006.

Chart 4: The Loss of Federal Funds Foster care is paid for with city, state and federal government dollars. The federal contribution collapsed in the middle part of the decade, when city officials acknowledged problems with the way they had been documenting claims for foster children's eligibility for funding under Title IV-E of the Social Security Act. So, despite the stunning decline in the number of foster children, the contribution to foster care from state coffers changed only modestly. And the contribution from city taxpayers was volatile across the decade, mostly plugging the huge hole opened up by the loss of federal funds.

Chart 5: Who Pays for Preventive Programs? As with foster care, funding for ACS preventive family support services comes from the city, state and federal governments. The portion paid for by the city was lower in 2010 than in 2000. Since an agreement reached in 2006, an increase or decrease in city tax levy funds spent on preventive services is amplified by the state, because Albany matches local dollars spent on these services with a formula of its own.

Chart 6: Preventive Services Funding Today In June 2011, the Bloomberg administration agreed to "baseline" ACS preventive family support services into the city budget at $230 million, almost exactly where it stood in 2010. This means that for the foreseeable future, the City Council may not have to fight to restore funding for preventive services every year. Dollars from the city still cover only a modest 20 percent of the preventive budget. (The figures in charts 6 and 7 are not adjusted for inflation, because they are so recent. The 2010 amount is actual expenditures. The 2011 and 2012 figures reflect what the city budgeted for these services.)

Chart 7: Foster Care and Adoption Almost Below $1 Billion This final chart shows the four major areas of child welfare funding in New York City, excluding core administrative services. The "Adoption" category is mostly made up of subsidies provided to adoptive families. (Nearly 80 percent of the city"s adoption budget comes from the state and federal governments.) One interesting note: In Fiscal Year 2012, for the first time in decades, the combined budget of New York City foster care and adoption services is close to falling below $1 billion. If current trends continue, that may indeed happen in 2013.
 An important acknowledgement: Thanks to the IBO and analyst Kate Maher for their help crunching these numbers.